On adding or editing a speciality you will need to define the main value(s) of shema(s) you've selected. A candlestick and a bar chart for each schema will be shown to you with the last 30 days swing and volume transactions so that you can select a resonable value for each.
At the side, a speciality with a Fix payment schema with a fix payment of 10.0 is being edited. It is being shown the fix payment' swing of the last 30 days and beneth it the number of transaction on each day. The initial value of 10.0 was resonable or "in market" at the beginning but become unresonable or "off market" as the parameter value decline with time.
Positive Candle
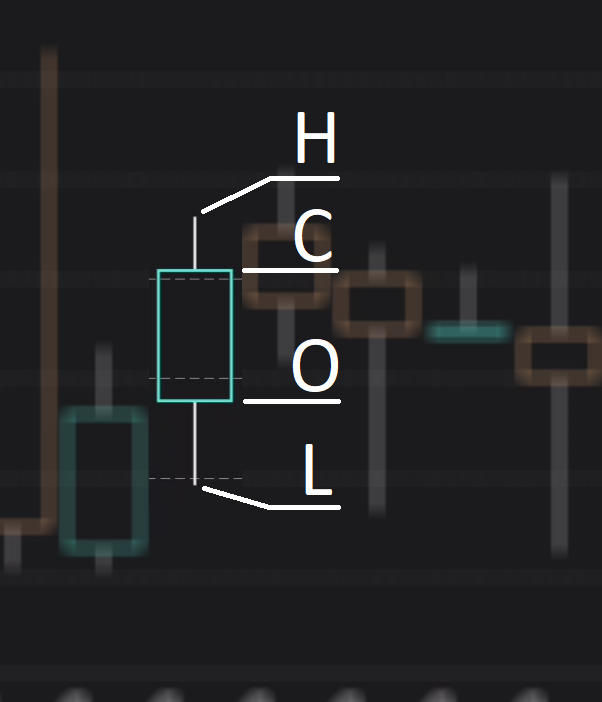
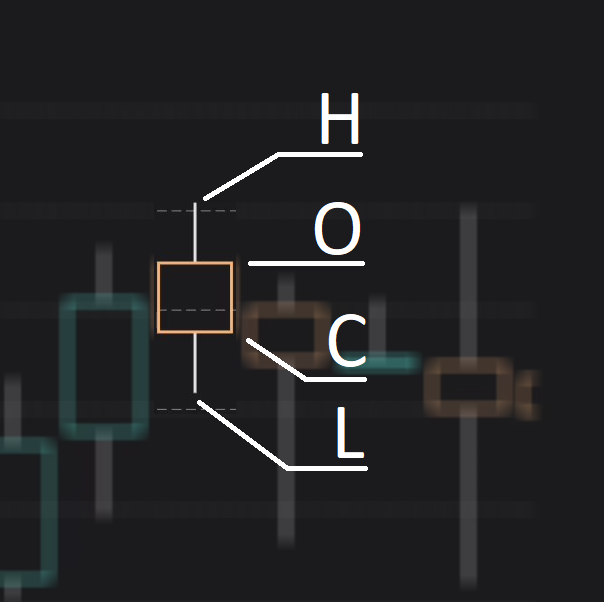
A candlestick diagram, or simply candle, represents some of the meaningful values during time scale price swing. The meaningful values are label with "H", "C", "O" and "L" and they represent the highest value "H", the last or close value "C", the first or open value "O" and the lowest value "L" of the time scale price swing.
On the image to the left the highest value of the daily swing was 8.5, it closed at 8.4, opened a little less then 8.2 and achieved a 8.0 at the lowest.

Negative Candle
The image to the left represents a daily swing that closed with a value lower that its opening while the image above show a daily swing with a closed value higher value that its opening. The destintion is made by the color of the candle's body being a blueish/greenish color indicating a higher closed than the opening and a redish color the oposite.

